
Google Data Analytics Capstone Project: Bellabeat Case Study
Created by Kacie Scott between Dec 2024 - Jan 2025
This study will follow the six phases of the data life-cycle: Ask, Prepare, Process, Analyze, Share, and Act.
INTRODUCTION
Howdy! My name is Kacie Scott and I’ve created this case study to complete a course within the Google Data Analytics Certification. I’ve chosen Bellabeat case study because personally I am excited by my own fitness data I find through my Fitbit watch. We live in a wonderful age of technology and how we stay on top of our fitness health through smart devices is intriguing. For this project I will be a Junior Data Analyst working in the marketing analyst team at Bellabeat.
*Click Here to review the Google Data Analytics Capstone: Complete a Case Study Course
Overview of the company: Bellabeat
In 2013 Urška Sršen and Sando Mur founded Bellabeat which is a high-tech company that manufactures health-focused smart products. These products collect data on sleep, stress, and reproductive health which has helped women all around the world to be empowered by the knowledge of their own health and habits.
What type of Bellabeat products are available?
Bellabeat app: The Bellabeat app provides users with health data related to their activity, sleep, stress, menstrual cycle, and mindfulness habits.
Leaf: Bellabeat’s classic wellness tracker can be worn as a bracelet, necklace, or clip. The Leaf tracker connects to the Bellabeat app to track activity, sleep, and stress.
Time: This wellness watch combines the timeless look of a classic timepiece with smart technology to track user activity, sleep, and stress. The Time watch connects to the Bellabeat app to provide you with insights into your daily wellness.
Spring: This is a water bottle that tracks daily water intake using smart technology to ensure that you are appropriately hydrated throughout the day. The Spring bottle connects to the Bellabeat app to track your hydration levels.
Bellabeat membership: Bellabeat also offers a subscription-based membership program for users. Membership gives users 24/7 access to fully personalized guidance on nutrition, activity, sleep, health and beauty, and mindfulness based on their lifestyle and goals.
ASK
What is the problem you are trying to solve?
I will be reviewing FitBit datasets in hopes of unlocking new growth opportunities by understanding how consumers are using their devices.
How can your insights drive business decisions?
By analyzing the data for trends and insights, I’ll be able to present my analysis with recommendations to help Bellabeat’s marketing strategy.
Who are key stakeholders at Bellabeat?
Urška Sršen - Bellabeat’s co-founder and Chief Creative Officer
Sando Mur - Mathematician and Bellabeat co-founder
Bellabeat marketing analytics team: A team of data analysts responsible for collecting, analyzing, and reporting data.
Business Task Statement:
Discover the main improvements that Bellabeat can implement to improve the usage of their products which will increase word of mouth and visibility.
PREPARE
Where is your data stored?
The data used in this case study are from the Möbius profile in Kaggle. The dataset origin of data was pulled from a survey via Amazon Mechanical Turk between 3/12/16 to 5/12/16.
Mobius creator is Arash Nicoomanesh who resides in Australia. On his profile through Kaggle he’s been awarded as a Kagglex Advisor and Community Competition Host with a healthy following on the platform. Additionally on Linkedin we can view how influential he is as a Data Scientist and Researcher having 10+ years of experience with LLMs, Big Data, machine learning, and software development. The data used is reliable from a credible site Kaggle with no licensing issues (License -CCO:Public Domain) however the dataset does not follow ROCCC.
Using the ROCCC system to determine credibility and integrity of the dataset?
Is it Reliable - No, due to small sample size (31 users) which limits insights.
Is it Original - No, the dataset was originally pulled from an Amazon Mechanical Turk survey.
Is it Comprehensive - The dataset lacks demographic data.
Is it Current - No, the data was collected in March & April 2016, and does not represent current trends being outdated.
Is it Cited - No, the dataset is found on Kaggle under Mobius profile with no additional info for credibility.
What is the Data?
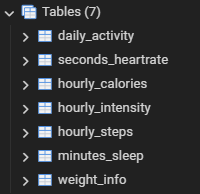
CSV files I’ll be reviewing, cleaning, and analyzing:
→ dailyActivity_merged.csv → heartrate_seconds_merged.csv
→ hourlyCalories_merged.csv →hourlyIntensities_merged.csv
→ hourlySteps_merged.csv →minuteSleep_merged.csv
→ weightLogInfo_merged.csv
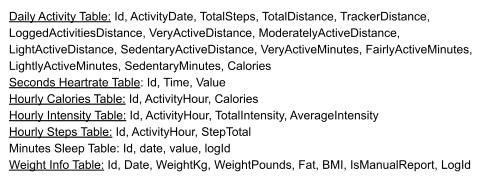
The data is organized in long format with the identification of those surveyed appearing multiple times in the ID column. Data types found within the files are integer, big integer, float or double precision, and boolean.
PROCESS
Chosen Tools? Google Sheets, PostgreSQL, Tableau, Snipping Tool

Reviewing the Data:
First I used Google Sheets however the system lagged for some of the csv files and I switched to pgAdmin4 where I created the tables and columns, then imported the data. I looked at the columns for each table to understand how the information was organized. Afterwards in pgAdmin4 I used the distinct clause to find the unique identification in each table.
The Cleaning Process
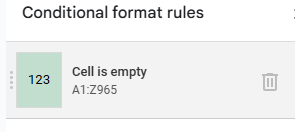
In Google Sheets checked for unnecessary white space with trim. Also created a conditional format rule to expose any empty cells. Repeated the process in other tables.
In weight_info the column named fat was missing values, only two cells had data, the rest were blank cells - Removed the entire column.
In the minuteSleep_merged.csv file, I downloaded into Google sheets. Separating the date and time into separate columns using =LEFT() and =RIGHT() functions.
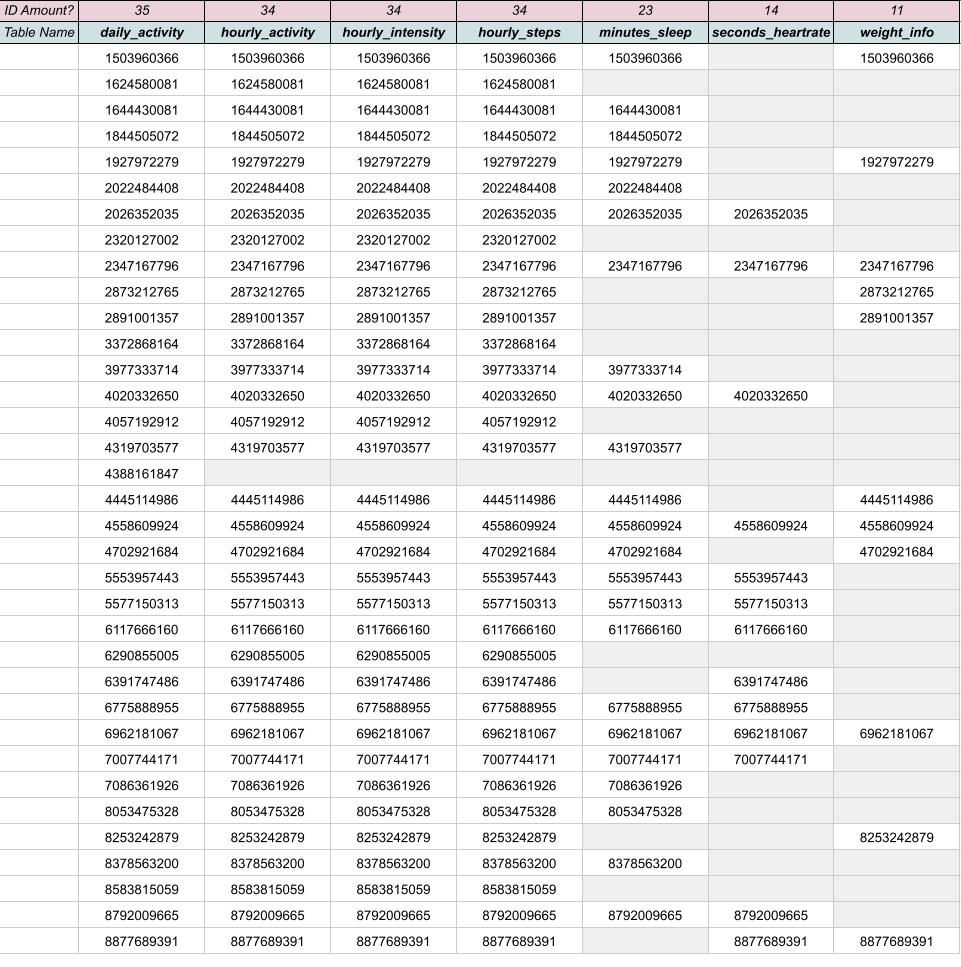
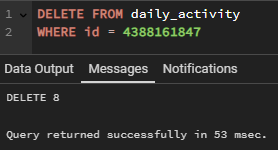
ID 4388161847 appeared only in the daily_activity table with 8 lines which had zeros in all the fields - Removed 8 rows.
The daily_activity table has the most information, I reviewed to see how each identification number compared to each other, noticing cells with zeros. In pgAdmin4 I used the count function and compiled the information into Google sheets. The rows for each subject ranged from 8 to 32. Fifteen subjects had 12 lines of data, two had the most with 32 lines of data, and the least was 8 lines of data. I reviewed the subjects that had 10 rows or less, removed those lacking data. Left with 31 unique id numbers.
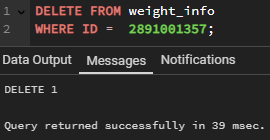
ID 2891001357 out of 8 rows, only had two lines of data - Removed 8 rows.
ID 6290855005 out of 10 rows, only had two lines of data - Removed 10 rows.
ID 6391747486 out of 9 rows, only had three lines of data - Removed 9 rows.


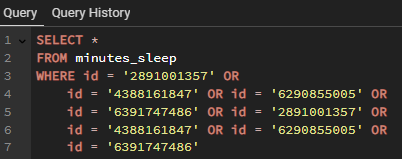
Reviewed other tables for ID 2891001357, ID 4388161847, ID6290855005, and ID 6391747486. None of the IDs appeared in the minutes_sleep table.
ID 2891001357 in seconds_heartrate table - Removed 3,747 rows.
ID 2891001357 in weight_info table - Removed one row.

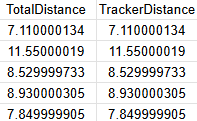
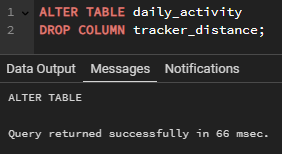
The daily_activity table columns ‘TotalDistance’ and ‘TrackerDistance’ appear as duplicate data - Removed in pgAdmin4 the ‘TrackerDistance’ column.
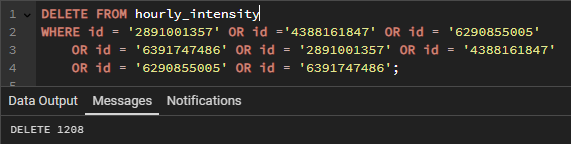
Reviewed the data in hourly_calories, hourly_steps, and hourly_intensity. Noticed that these tables had fitbit users that had been removed in daily_activity. To stay consistent across all the data I removed these ids from each hourly table: 2891001357, 6290855005, 6391747486, 2891001357, 4388161847 and 6290855005. Removed 1,208 rows in each table.


Removed weight_info due to not enough data to find insights. In Tableau I was hoping to see a line increase or decrease in weight, but the fitbit users did not input weight daily, if at all.
Removed minutes_sleep and seconds_heartrate after reviewing the data I focused on the daily_activity chart having the most information. Additionally, I looked at the hourly data for calories, intensity, and steps.
Outliers? Many of the subjects have zero data for various days but I only removed those that severely lacked information.
Tables Used After Reviewing? Daily_activity, Hourly_calories, Hourly_intensity, Hourly_steps
ANALYZE
CALCULATIONS
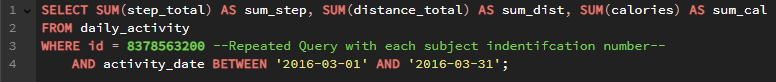
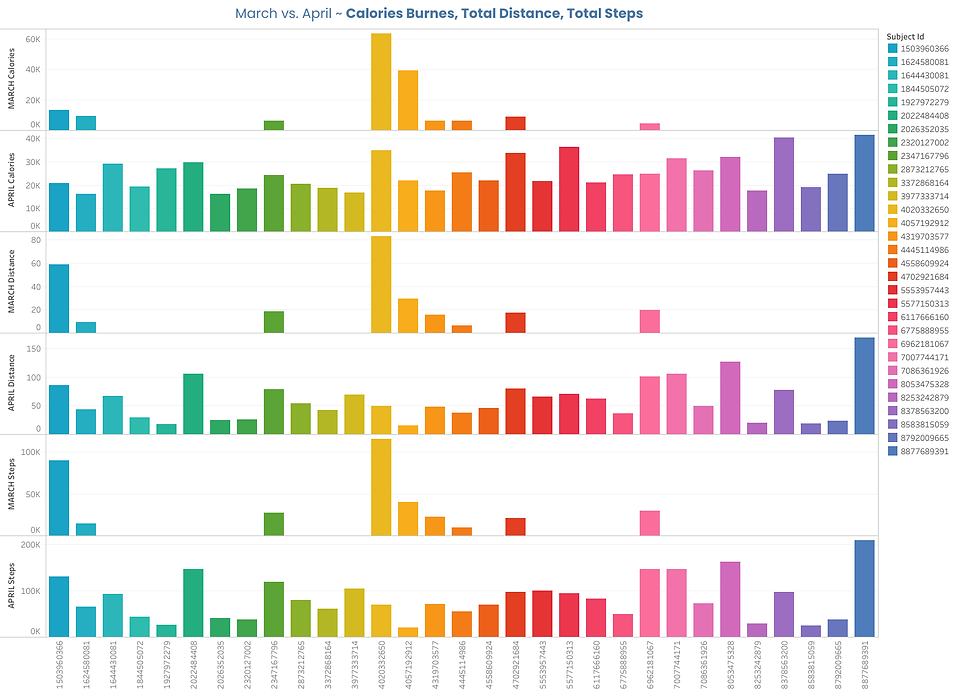
In the daily_activity table I used pgAdmin to find the sum of steps, distance, and calories collectively in the month March and April to understand the differences that occurred for each subject in both months. Queried the data for March and April and then copied it over to Google Sheets to analyze.

In Google Sheets I used these calculations to understand the Total steps:
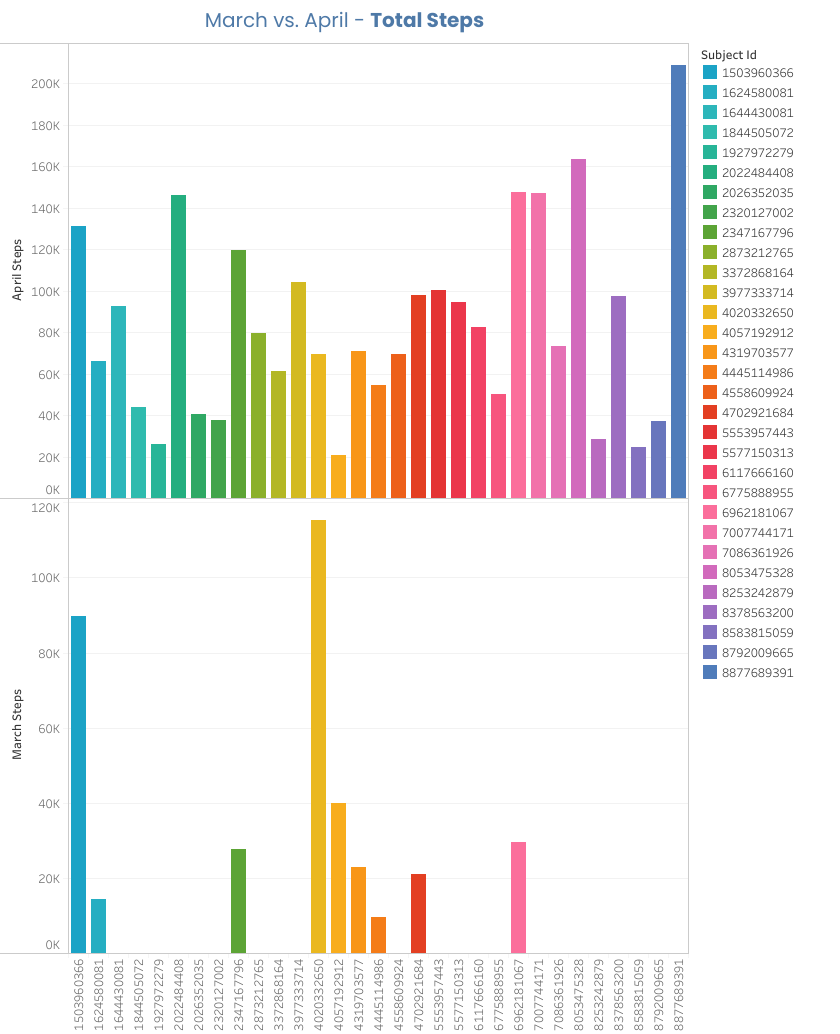
=SUM(B2+E2) - The total steps in March & April for each ID
=SUM(C2+F2) - The total distance in March & April for each ID
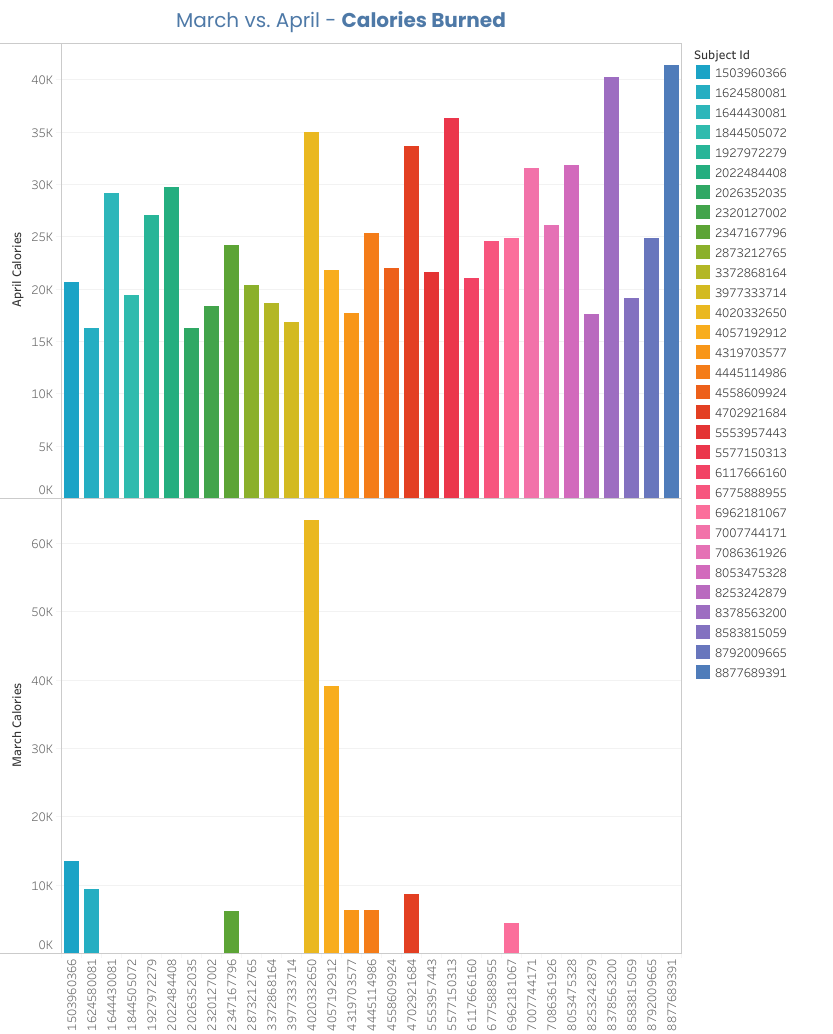
=SUM(D2+G2) - The total calories in March & April for each ID

These are the calculations applied to all the compiled data in Google Sheets to understand the Total Value, Highest Value, and Lowest Value across for March in regards to steps, distance, and calories. I also applied these calculations for April month as well to compare and contrast.
=SUM(B2:B32 // E2:E32) - Total amount of March and April Steps across all subjects
=MAX(B2:B32) - Highest Value in March Steps was ID 4020332650
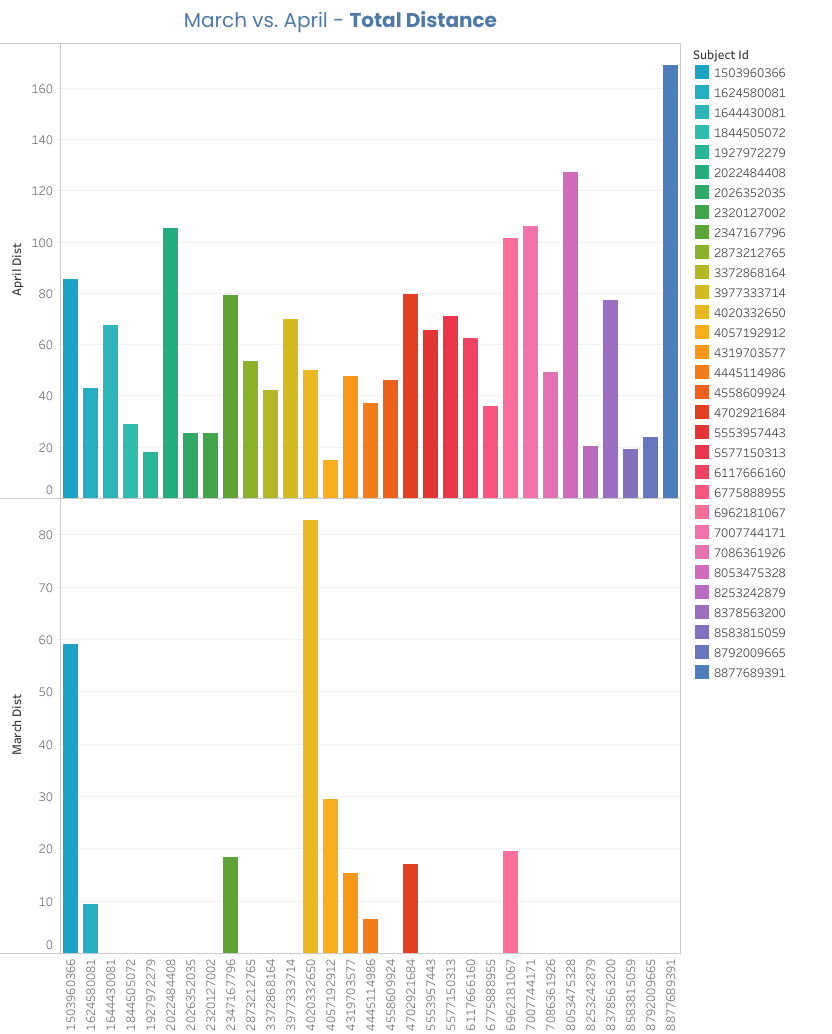
=MAX(E2:E32) - Highest Value in April Steps was ID 8877689391
=MIN(E2:E32) - Minimum Value in April Steps was ID 4057192912
=SUM(C2:C32 // F2:F32) - Total amount of March and April Distance across all subjects
=MAX(C2:C32) - Highest Value in March Distance was ID 4020332650
=MAX(F2:F32) - Highest Value in April Distance was ID 8877689391
=MIN(F2:F32) - Minimum Value in April Steps was ID 4057192912
=SUM(D2:D32 // G2:G32) - Total amount of March and April Calories across all subjects
=MAX(D2:D32) - Highest Value in March Calories was ID 4020332650
=MAX(G2:G32) - Highest Value in April Calories was ID 8877689391
=MIN(G2:G32) - Minimum Value in April Steps was ID 1624580081
=MIN(B2:B32) // =MIN(C2:C32) // =MIN(D2:D32) --Displayed 0 in March Lowest Values
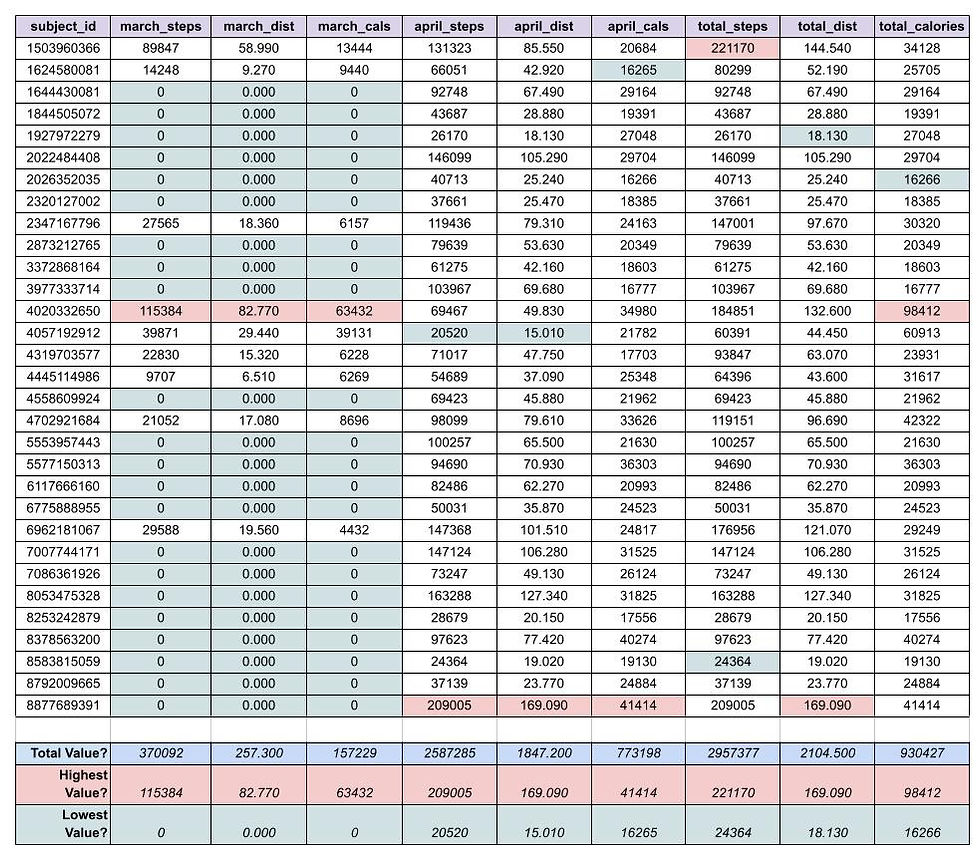
These are the calculations used in Google Sheets for understanding the total steps, total distance, and total calories burned collectively in April & March.
=SUM(I2:I32) --Total steps in daily_activity data was 2,957,377
=SUM(J2:J32) --Total distance in daily_activty data was 2,104.5 km
=SUM(K2:K32) --Total calories burnt in daily_activity was 930,427
=MAX(I2:I32) --Highest Value for Total Steps was ID 1503960366
=MAX(J2:J32) --Highest Value for Total Distance was ID 8877689391
=MAX(K2:K32) --Highest Value for Total Calories was ID 4020332650
=MIN(I2:I32) --Lowest Value for Total Steps was ID 8583815059
=MIN(J2:J32) --Lowest Value for Total Distance was ID 1927972279
=MIN(K2:K32) --Lowest Value for Total Calories was ID 2026352035
Afterwards I wanted to take a dive into how steps changed daily collectively by all the IDs. I used pgAdmin and queried the average and sum for steps for each date. Pulling the data into Google Sheets I was able to see the data better, coloring Saturdays green and Sundays blue.


In Google Sheets I replicated the calculations from pgAdmin to validate the data and found all the numbers matched.
Continuing in Google Sheets I wanted a better visual for the weekdays and how the highest # in red and lowest # in blue for Total Steps compared to highest # in red and lowest # in blue for Average Steps. These are the calculations I pulled from the spreadsheet with Date, Average Steps, Total Steps to find the combined amount for Total Steps and Average Step by weekday.
=SUM(C2,C9,C16,C23,C30) // =SUM(B2,B9,B16,B23,B30) - Saturday Total Step & Average Steps
=SUM(C3,C10,C17,C24,C31) // =SUM(B3,B10,B17,B24,B31) - Sunday Total Step & Average Steps
=SUM(C4,C11,C18,C25,C32) // =SUM(B4,B11,B18,B25,B32) - Monday Total Step & Average Steps
=SUM(C5,C12,C19,C26,C33) // =SUM(B5,B12,B19,B26,B33) - Tuesday Total Step & Average Steps
=SUM(C6,C13,C20,C27,C34) // =SUM(B6,B13,B20,B27,B34) - Wednesday Total Step & Average Steps
=SUM(C7,C14,C21,C28,C35) // =SUM(B7,B14,B21,B28,B35) - Thursday Total Step & Average Steps
=SUM(C8,C15,C22,C29,C36) // =SUM(B8,B15,B22,B29,B36) - Friday Total Step & Average Steps

Summary of the Data Analysis
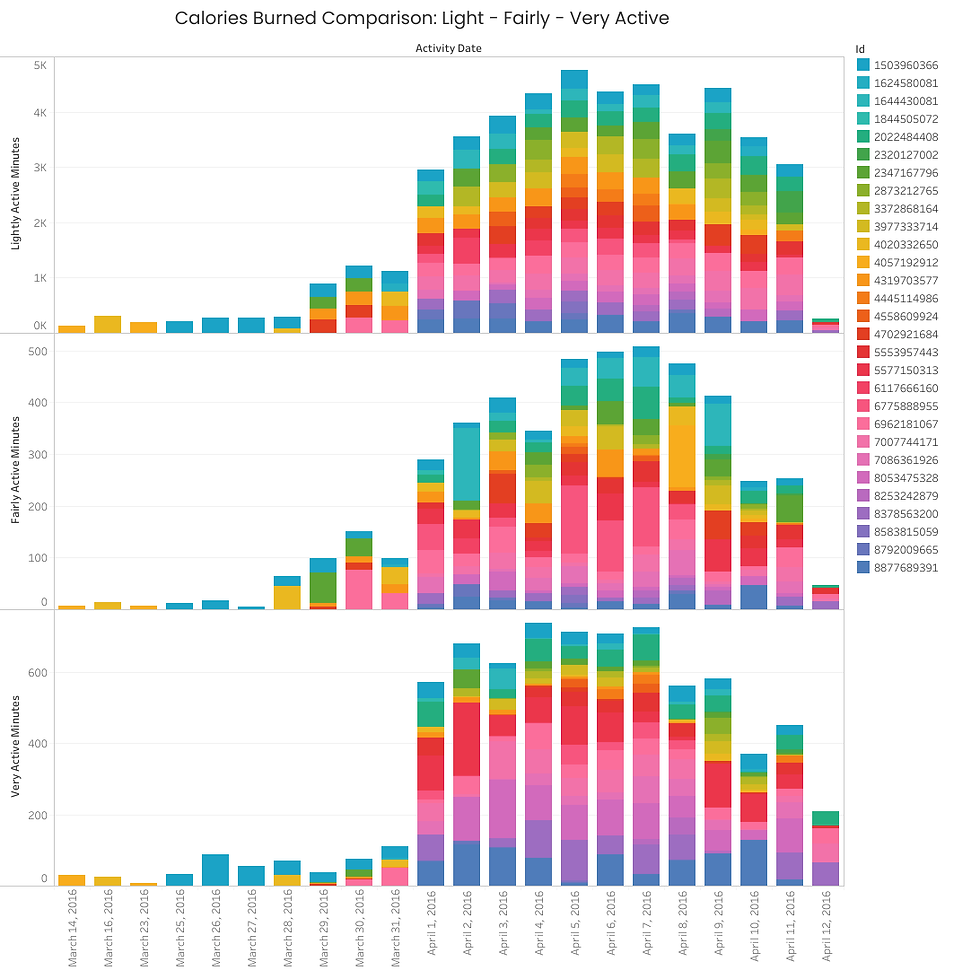
When comparing March versus April Data, the participation was a slow start.
Only 29.03% used their Fitbit Devices in March. Compared to 100% usage in April.
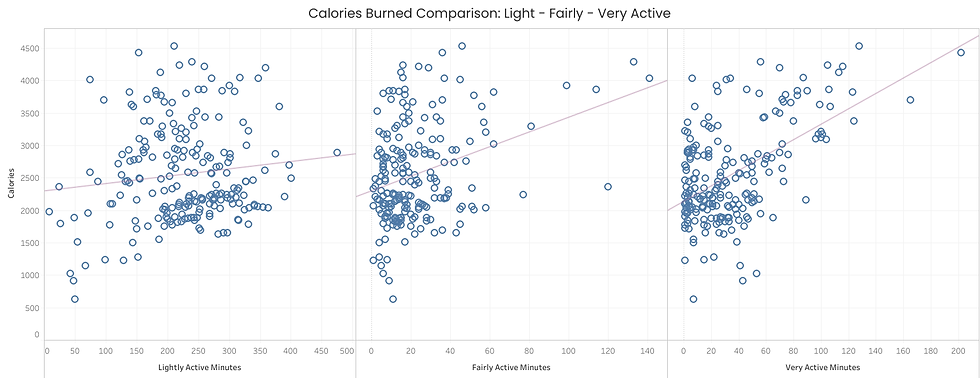
When reviewing calories burned in Lightly Active Minutes, Daily Active Minutes, and Very Active Minutes - there is an upward trend.
There is a positive correlation between activity level & calories burned. The more active you are with higher-intensity exercises, the more calories you will burn.
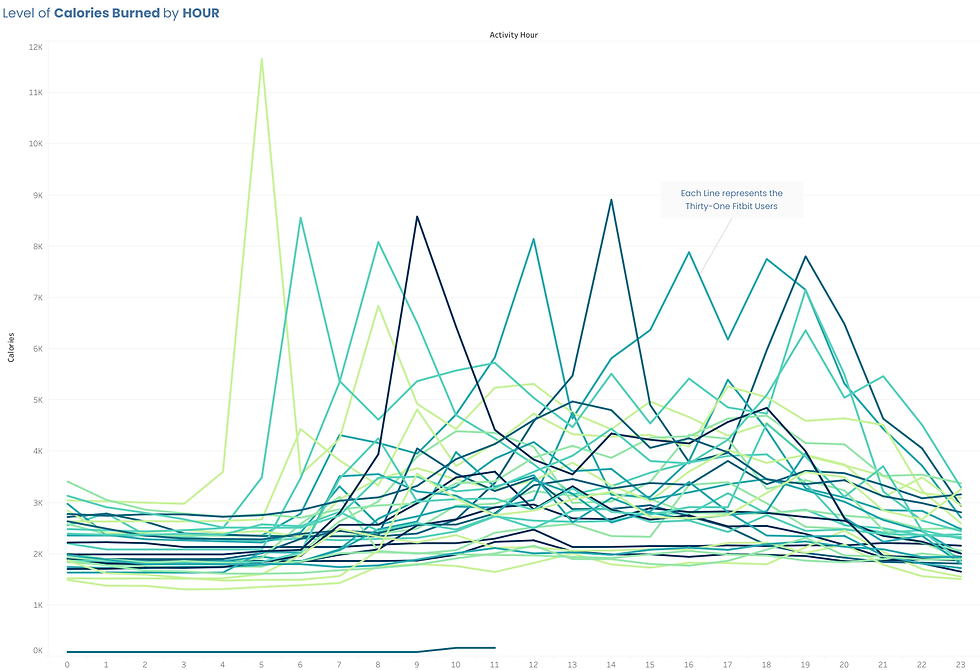
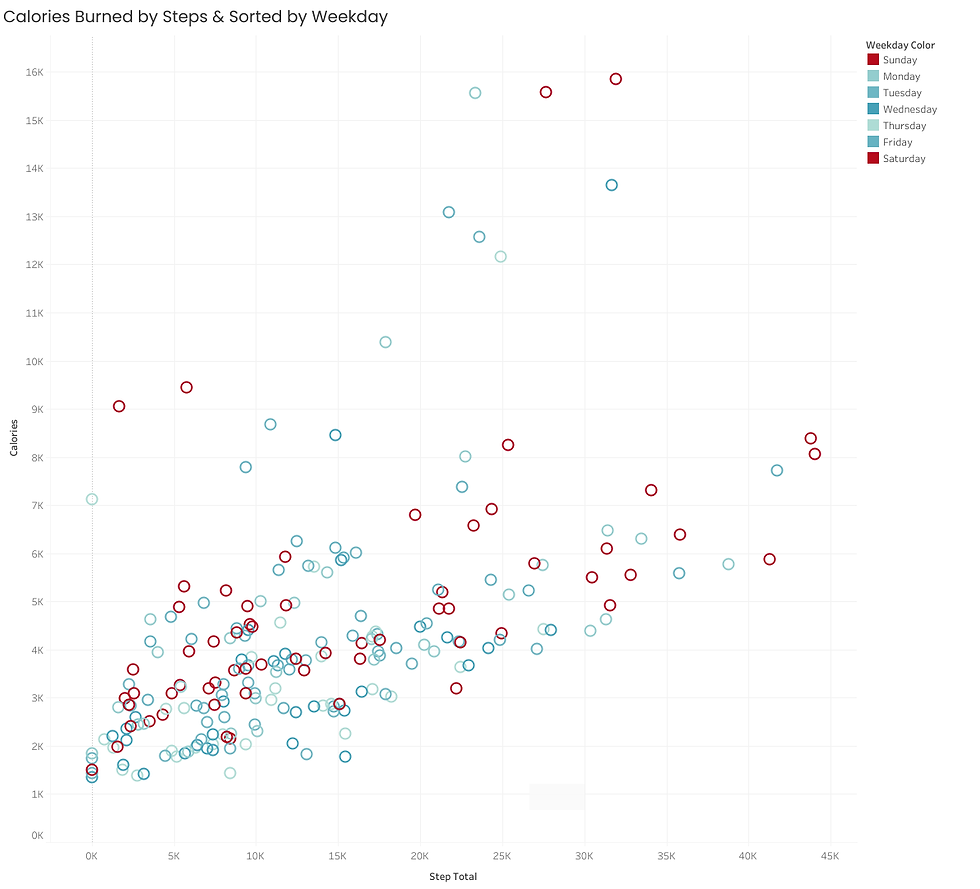
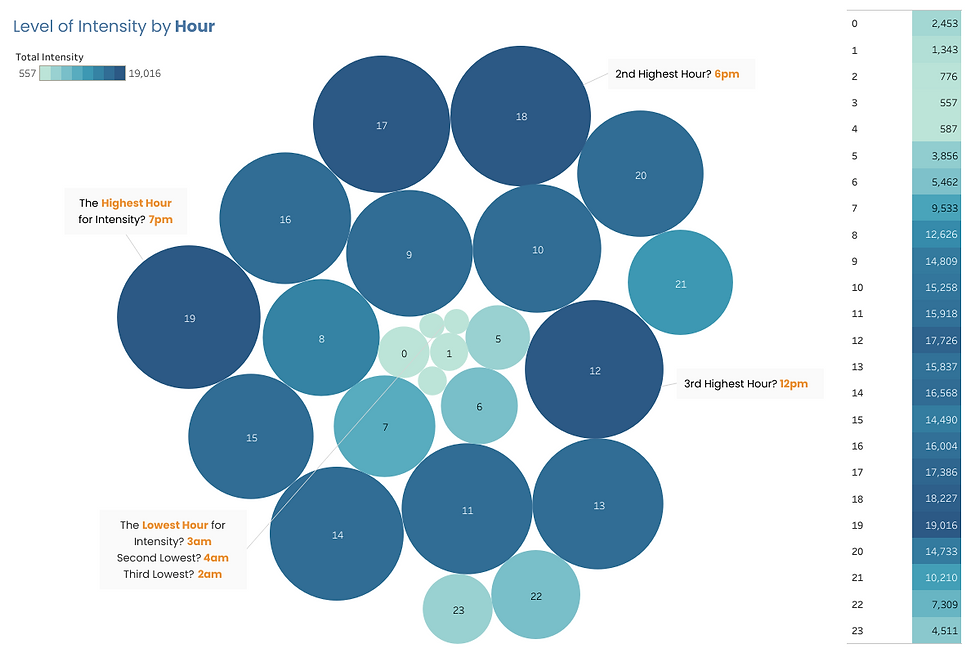
When reviewing fluctuations by the hour for Calories Burned and Level of Step Activity, the Fitbit users each have various peaks and lows. There was not one pivotal similarity across the board for all the users. There were some insights in regards to time of day.
Majority of Users wake around 6am to 8am.
Users tend to stay active consistently between 9am to 7pm.
Majority of Users fall asleep around 9pm to 11pm.
Fitbit Users Least Active Hour? 3am. And Fitbit Users Most Active Hour? 7pm.
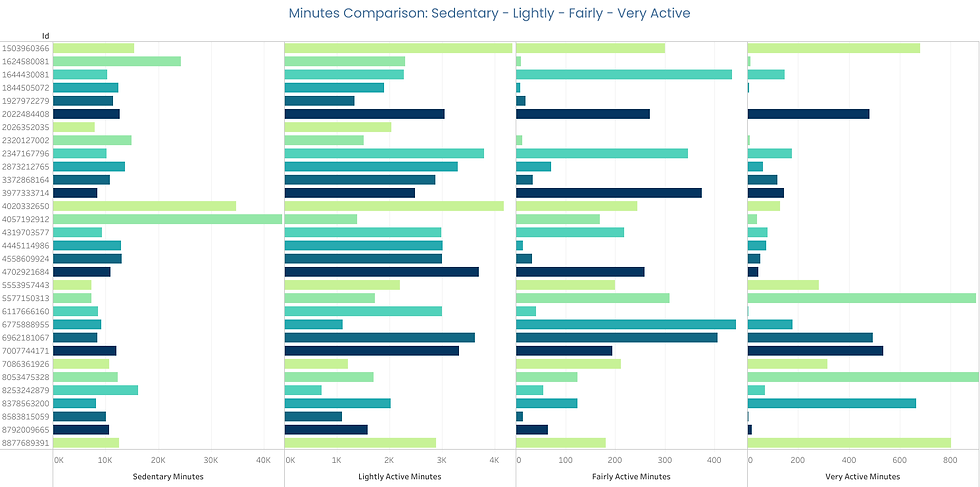
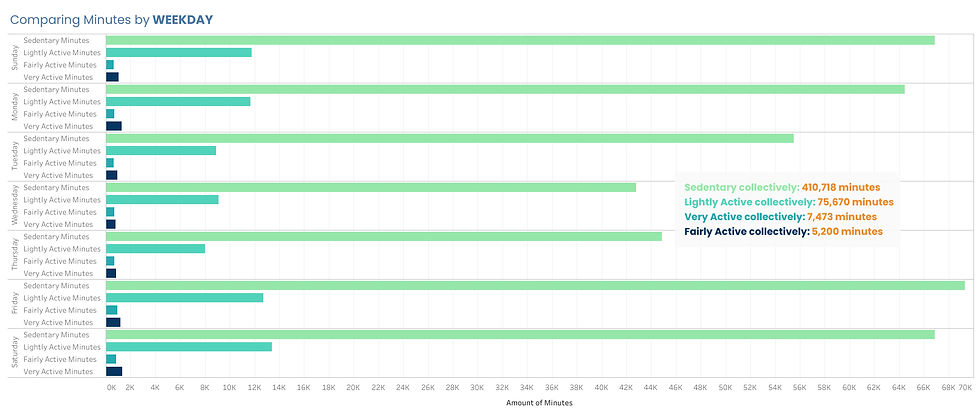
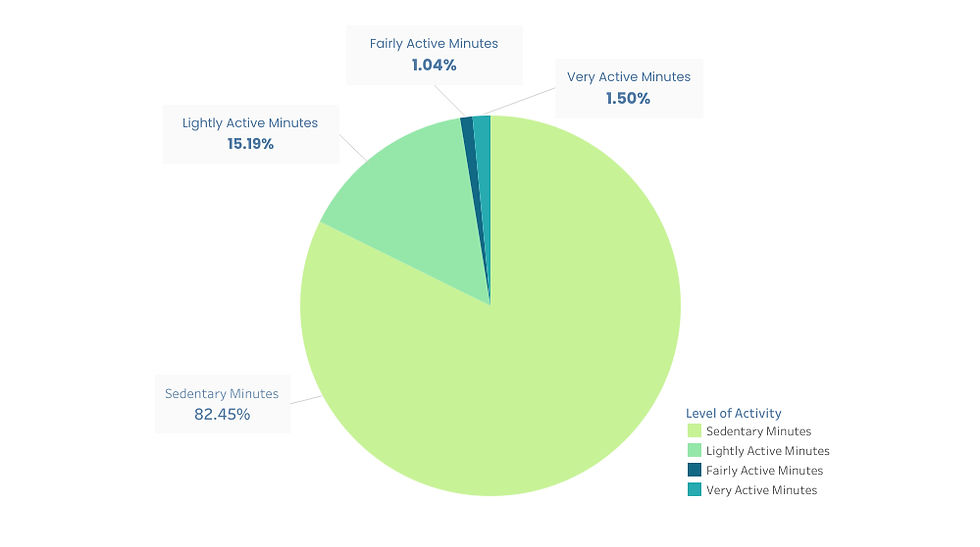
When comparing minutes (Sedentary Minutes, Lightly Active Minutes, Fairly Active Minutes, Very Active Minutes) by each Fitbit User, the Majority is Sedentary Minutes. I understand sedentary minutes to be large stagnant periods of time usually related to sleep - however in this world of technology it also could be media related, like watching a movie or playing on your phone before bed.
Sedentary collectively: 410,718 minutes
Lightly Active collectively: 75,670 minutes
Very Active collectively: 7,473 minutes
Fairly Active collectively: 5,200 minutes
It appears the highest day of the week for Sedentary is Friday & lowest day is Wednesday.
Additionally when examining the minutes collectively Sedentary dominates at a substantial 82.45% of all the minutes recorded- while Fairly Active being the lowest amount at 1.04% of all the Minutes recorded. Found this by adding the minutes collectively and finding the percentage of each minute level.
→ 410,718 + 75,670 + 7,473 + 5,200= 498,061minutes
→ Sedentary: 82.45% // Lightly: 15.19% // Very Active: 1.50% // Fairly: 1.04%.
The CDC recommends walking 10,000 steps per day.
Only 16.13% of Fitbit users met CDC recommendations for steps
With 83.87% unable to reach that goal.
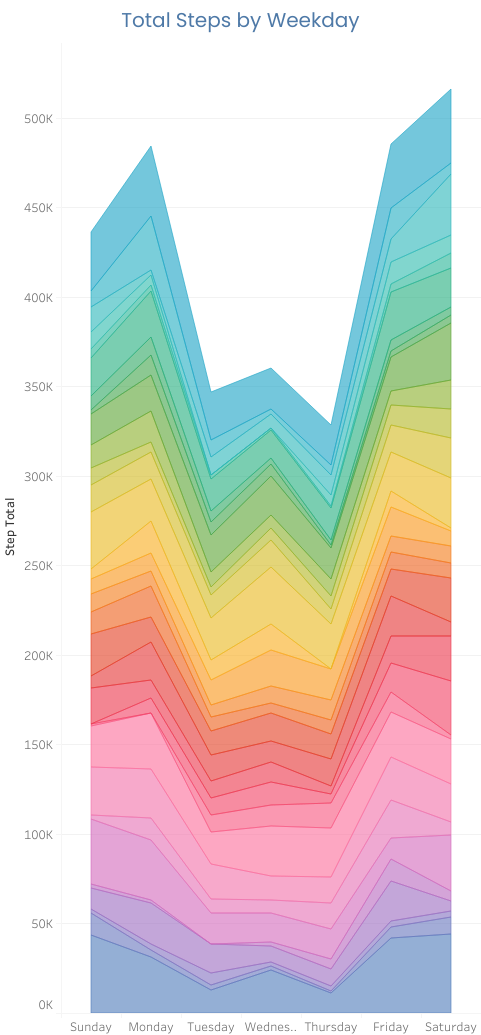
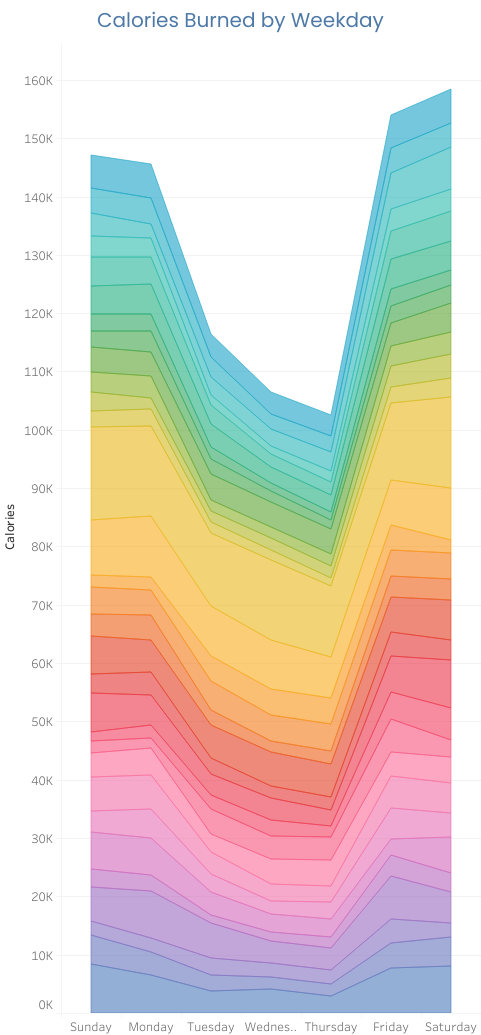
When comparing Steps, Distance, and Calories Burned during each day of the Week. We can see trends emerge.
Saturday is the highest in all three categories! Sunday, Monday, and Friday are close behind.
With Thursday being the lowest in activity, showing a slump during the midweek in general.
Trends emerge as we view the level of Intensity collected for each Fitbit User by the Hour.
The highest hour for intensity was 7pm.
Second highest hour was 6pm and the third highest hour was 12pm.
The lowest hour for intensity was 3am.
Second lowest hour was 4am and the third lowest hour was 2am.
The Fitbit Users had peaks at 12pm (lunchtime) and 6-7pm (dinner/evening time).
The low hours appear understandable due to being early hours in the morning when a majority of folks are sleeping.
→ The data collected proves that Fitbit users are not wearing their devices daily, many days were missing data. Even a few users were removed from the data analysis due to lacking information to pull insights from. The overall data raised concerns due to showing a lack of consistency, momentum throughout the week, or level of motivation.
SHARE
Through Google Slides I created mock presentation for stakeholders with an agenda:
→ About Bellabeat & Products
→ What is the Business Task?
→ What are the Data Limitations?
→ Understanding the Fitbit Dataset
→ Diving into the Data Visuals
→ What are the Key Insights?
→ Recommendations for Bellabeat
→ Reflections & Questions
Taking a Closer look at the Visuals I made on Tableau:


ACT
Main Recommendations for Bellabeat stakeholders?
→To help participation rise within the first month of usage:
Create interactive how-2 videos which will help users understand how to optimize the product.
Create an on/off ‘Helpful Hint’ feature to guide users when interacting with the Bellabeat App.
→To stop Sedentary Minutes from dominating:
Create a reward system (points, discounts, fitness coupons) for surpassing set movement goals.
Create a fun pop-up animation when you meet your daily step goals. This could help users work towards the CDC recommendation of 10,000 daily steps.
Create an on/off ‘Health Guru’ feature to help educate the user on different health risks. Example being one's risk of chronic health problems increases with long periods being Sedentary.
→To help with consistency throughout the week and avert lost momentum on Thursday:
Bellabeat App can send daily reminders in the morning to wear their device which will help the user have accurate data insights overall.
Create a separate workout reminder that’s attachable to an alarm or calendar, helping the user stay on track.
Create a ‘Link Up’ feature where you can connect, compete, or compare with friends and family.
→Highlight Golden Hours & Days:
Send a monthly or weekly report of Bellabeat users collectively to showcase the Top Day & Hour of highest activity.
Have a feature where the individual user can see their personal successes and the ability to share on social media platforms.
Offer a small discount on Bellabeat Products when you meet all your set goals for a month.
How could your team and business apply your insights?
Get approval from stakeholders, formulate a priority list, create a plan with developers & analysts, reach out to valuable departments like marketing, and begin improving Bellabeat users experience.
Is there additional data you could use to expand on your findings?
Yes, pull actually Bellabeat data or current Fitbit Device Usage so the data findings have credibility and integrity. As technology becomes extremely prevalent these insights will change and staying flexible as well as pulling datasets regularly will improve the analysis.
Comentarios